Why your best quarter looks like your worst.
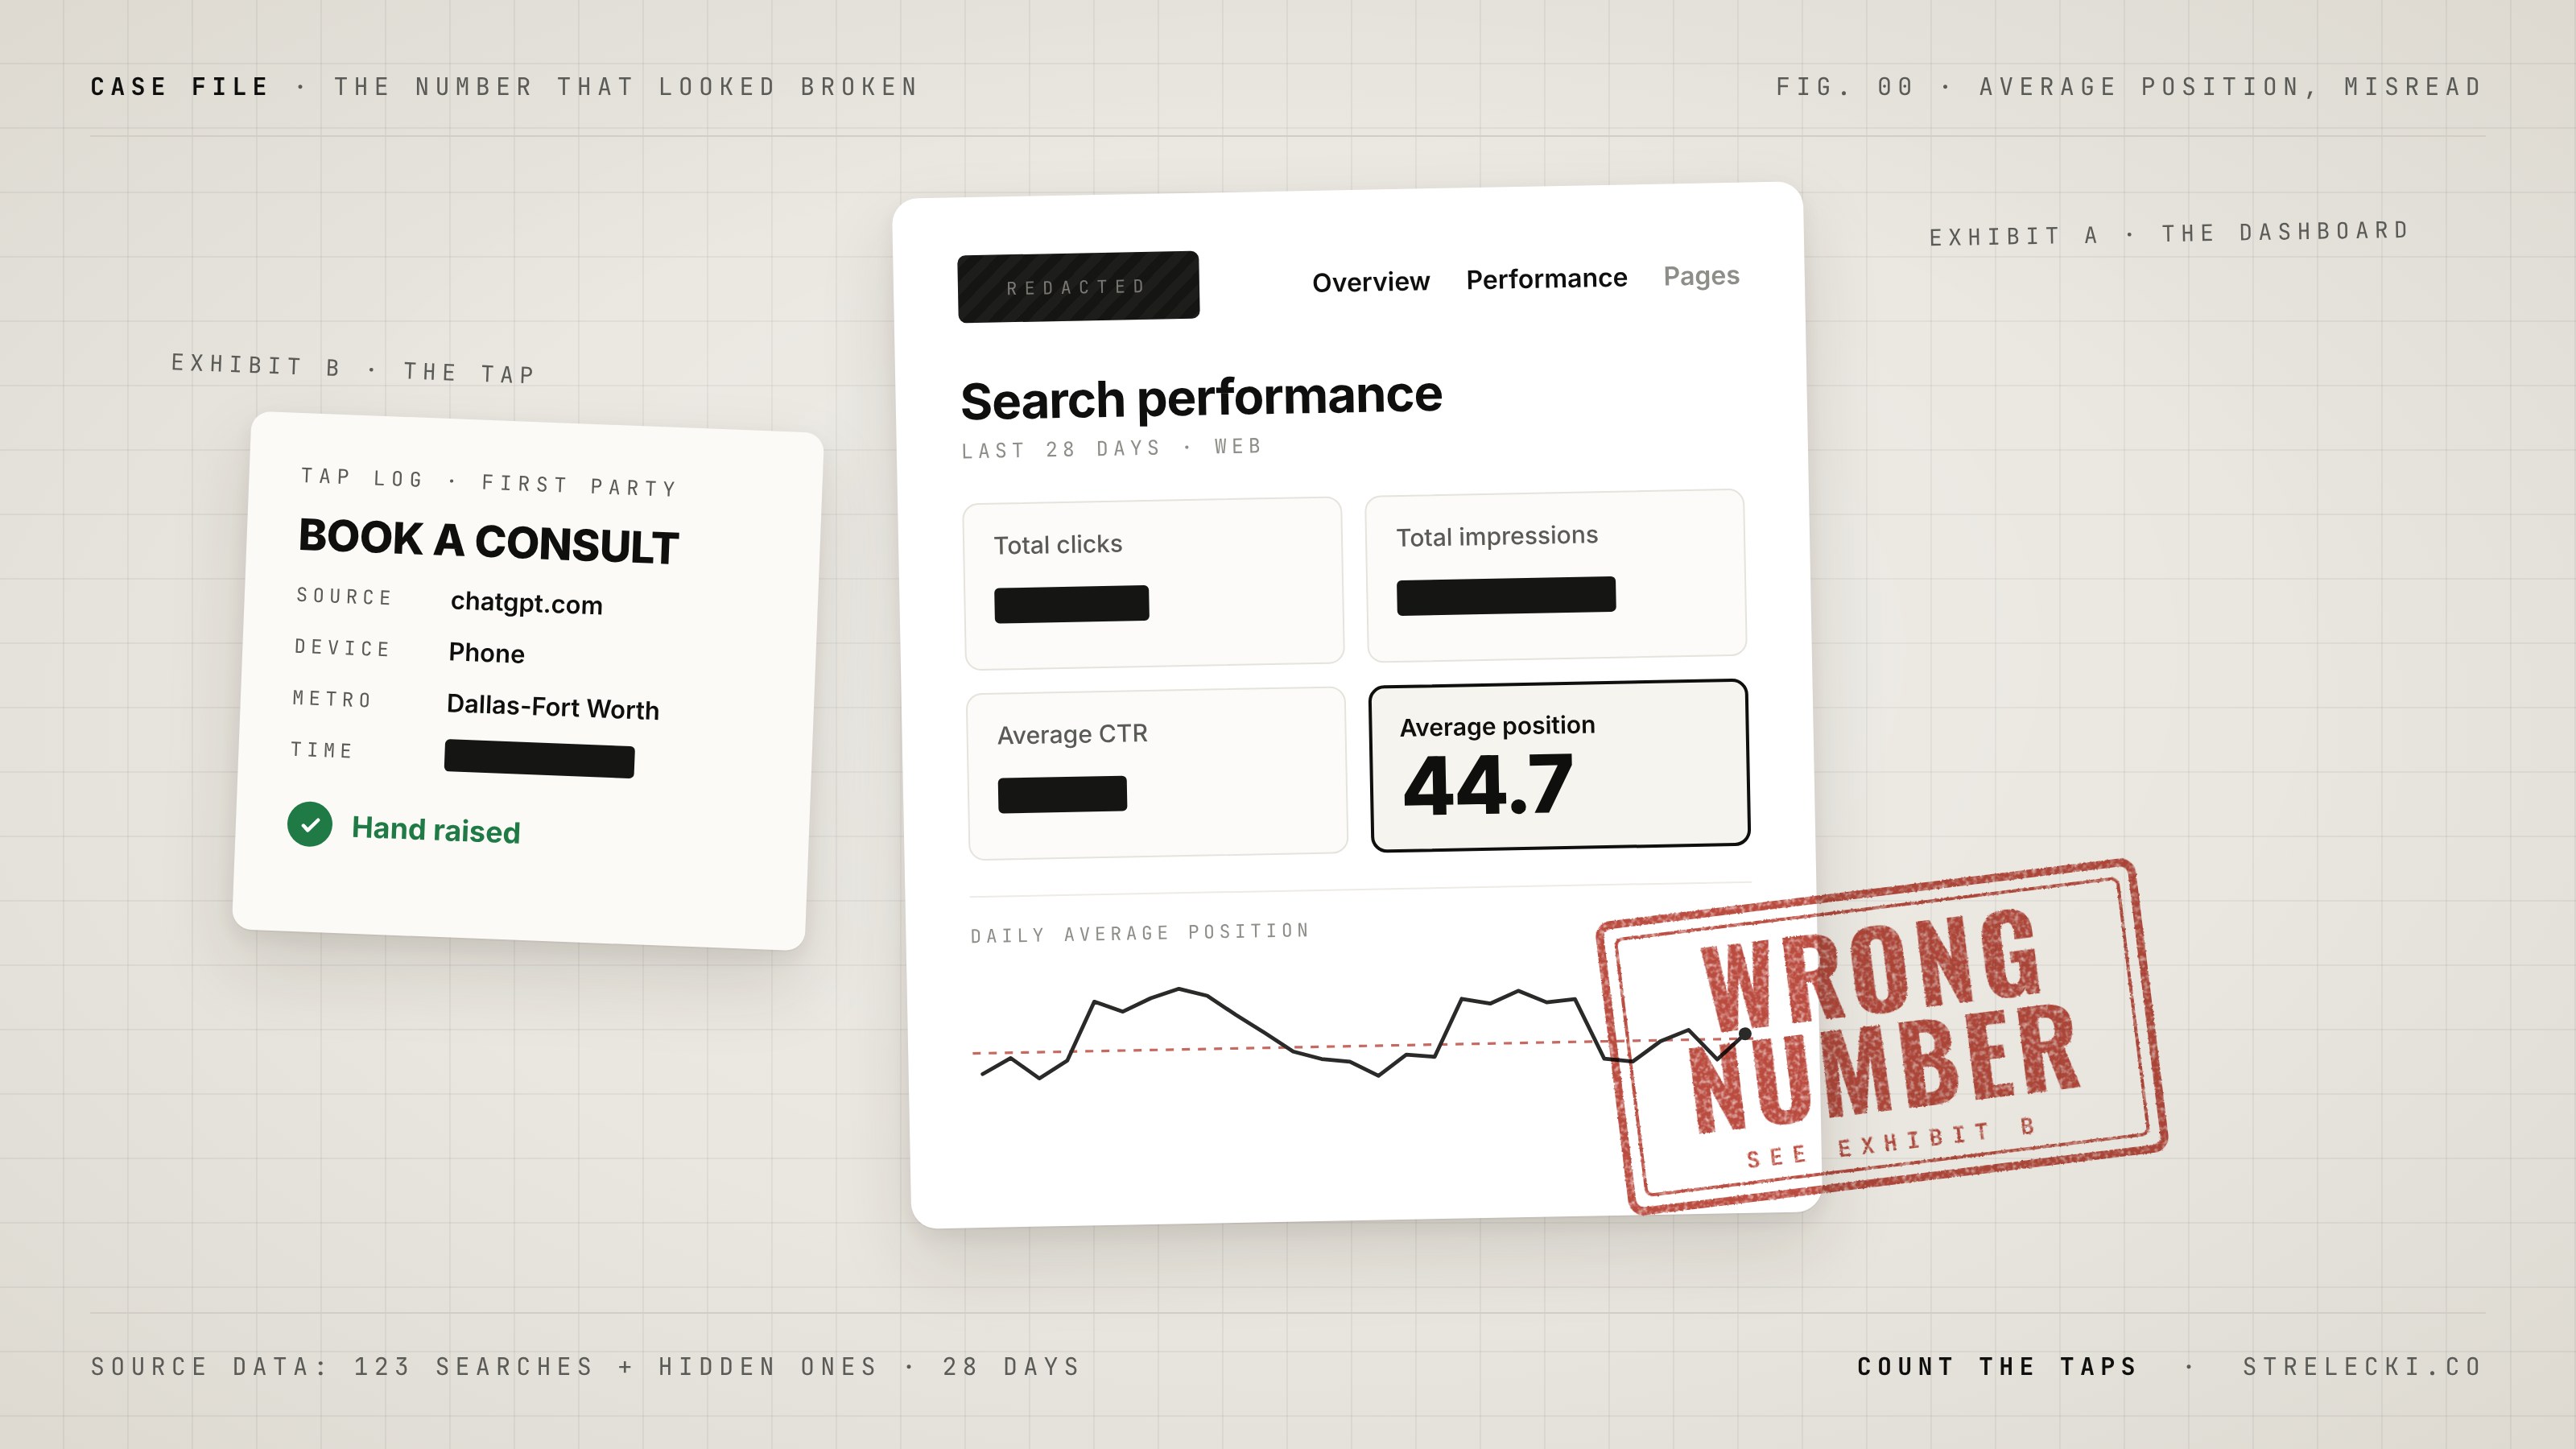
One week in October, the day Google showed my wife's website the most was its worst day for average ranking. Average health score and license utilization can do the same thing in your best quarter.

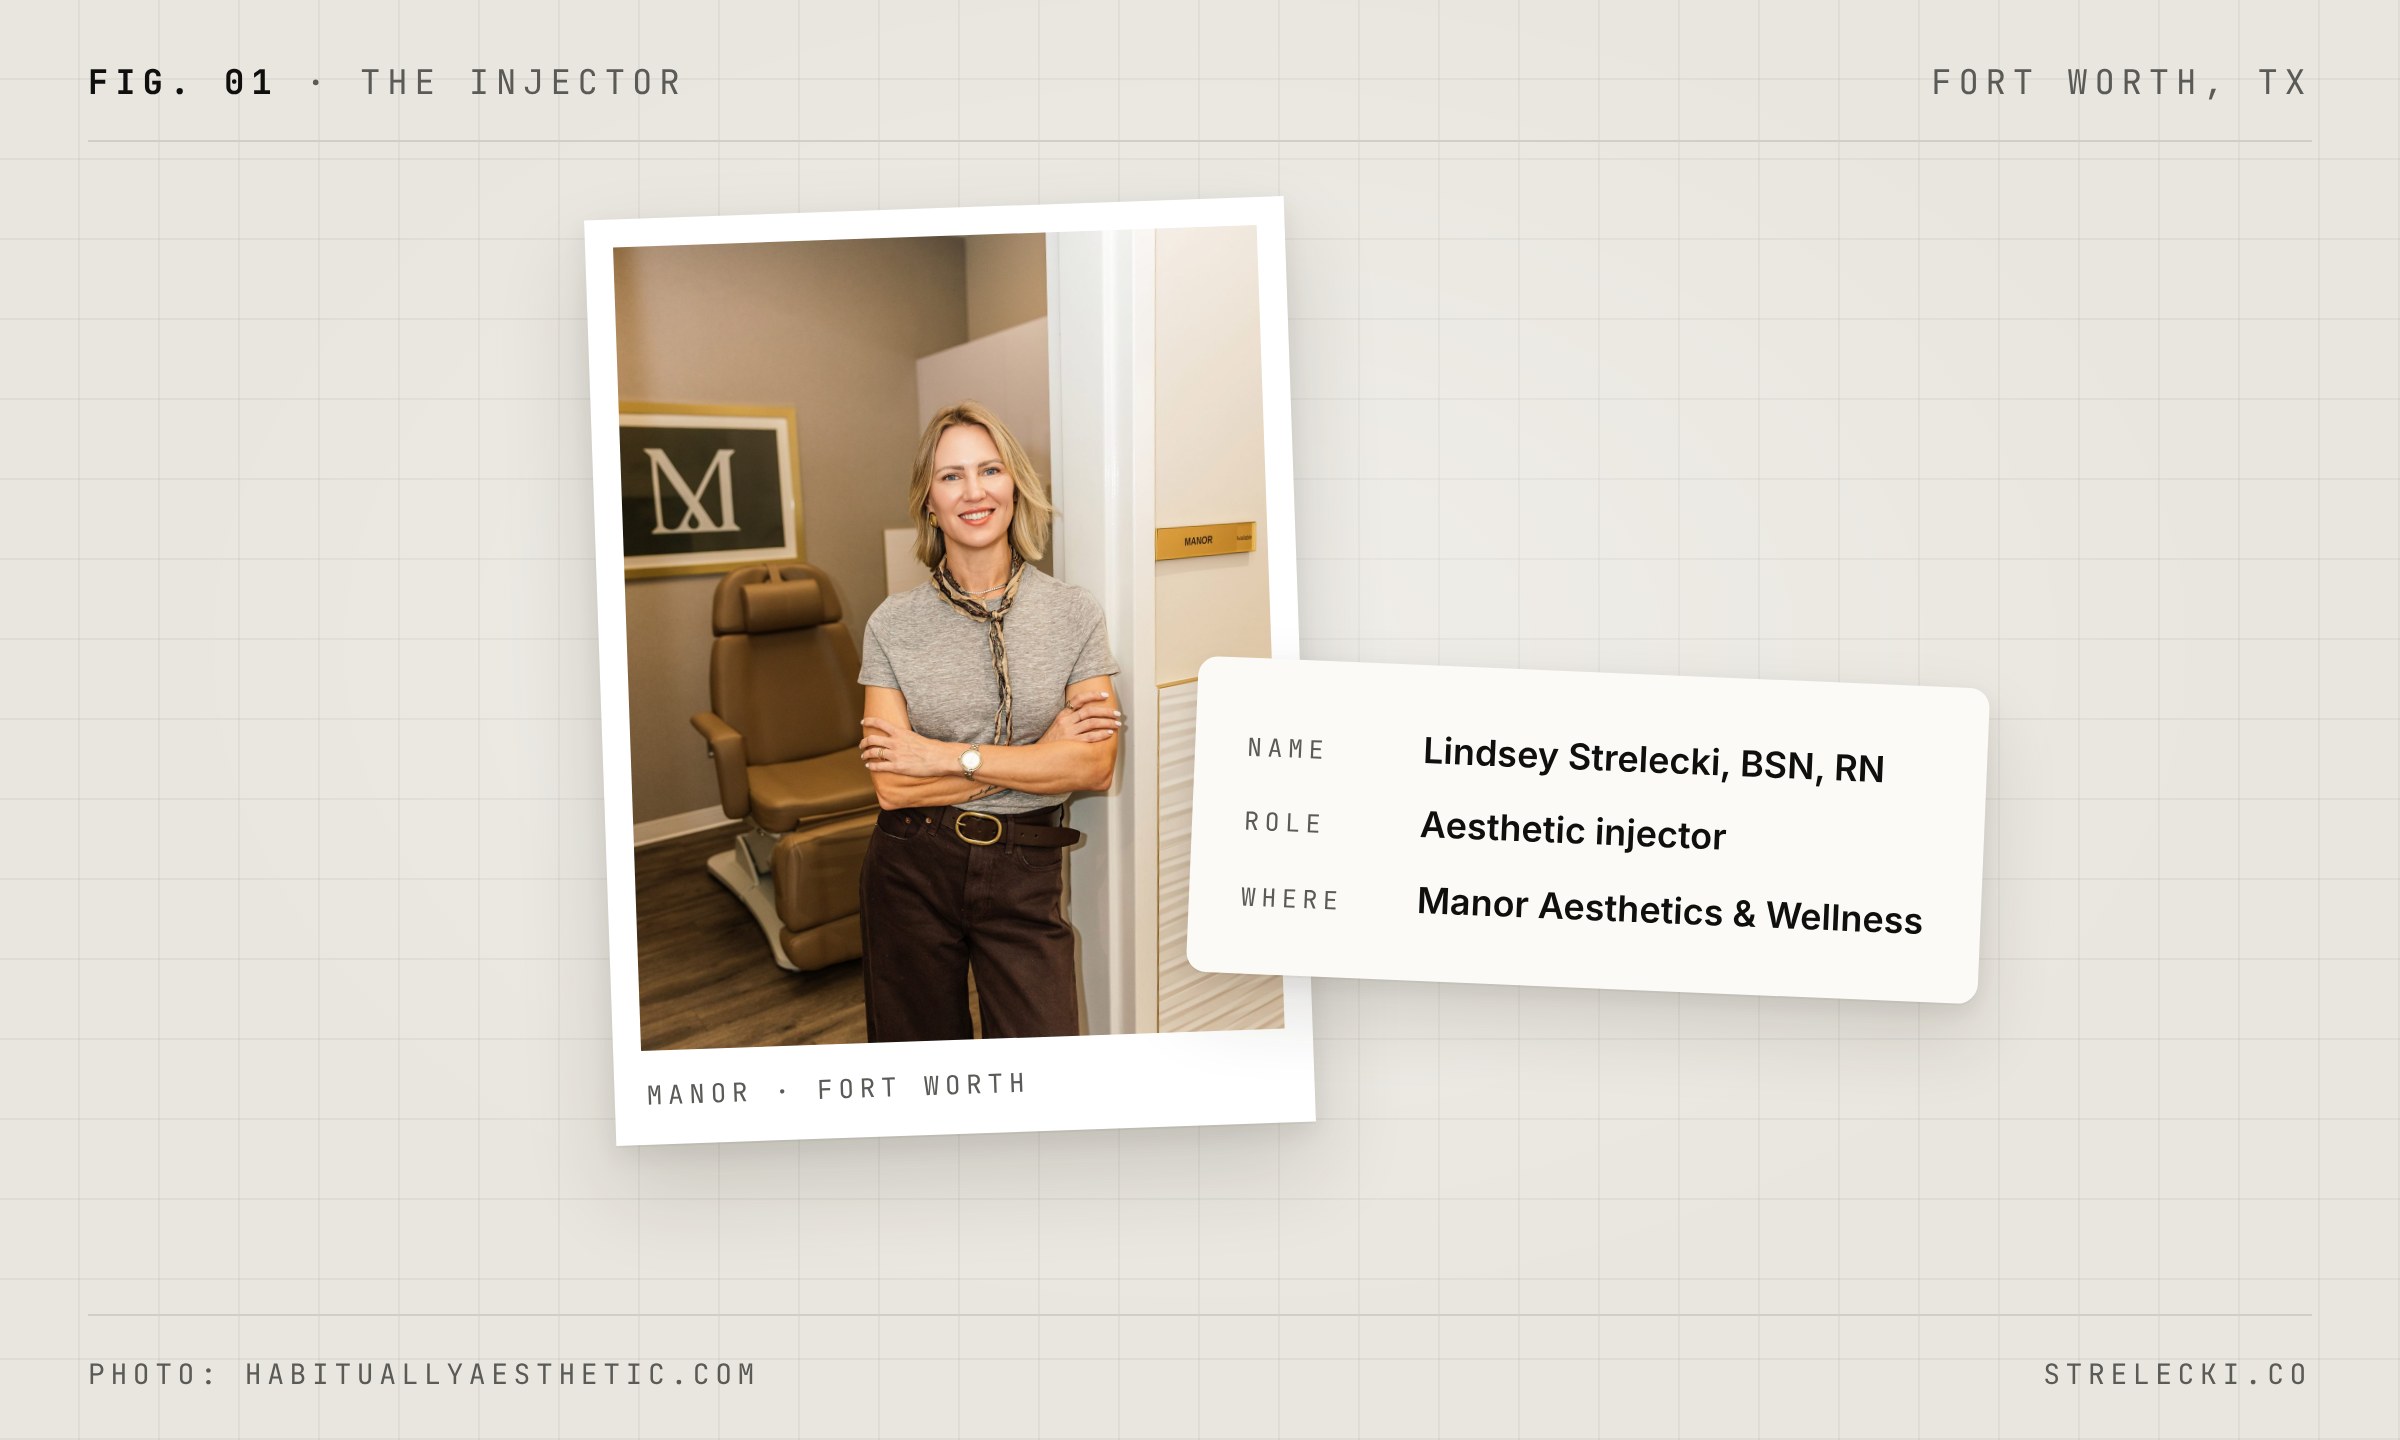
My wife Lindsey is an aesthetic injector in Fort Worth. Twenty-plus years as a nurse, a lot of it in a cardiovascular ICU.
This summer I built habituallyaesthetic.com so people searching Google or asking ChatGPT would find Lindsey. I tracked it the way I’d track a SaaS business.
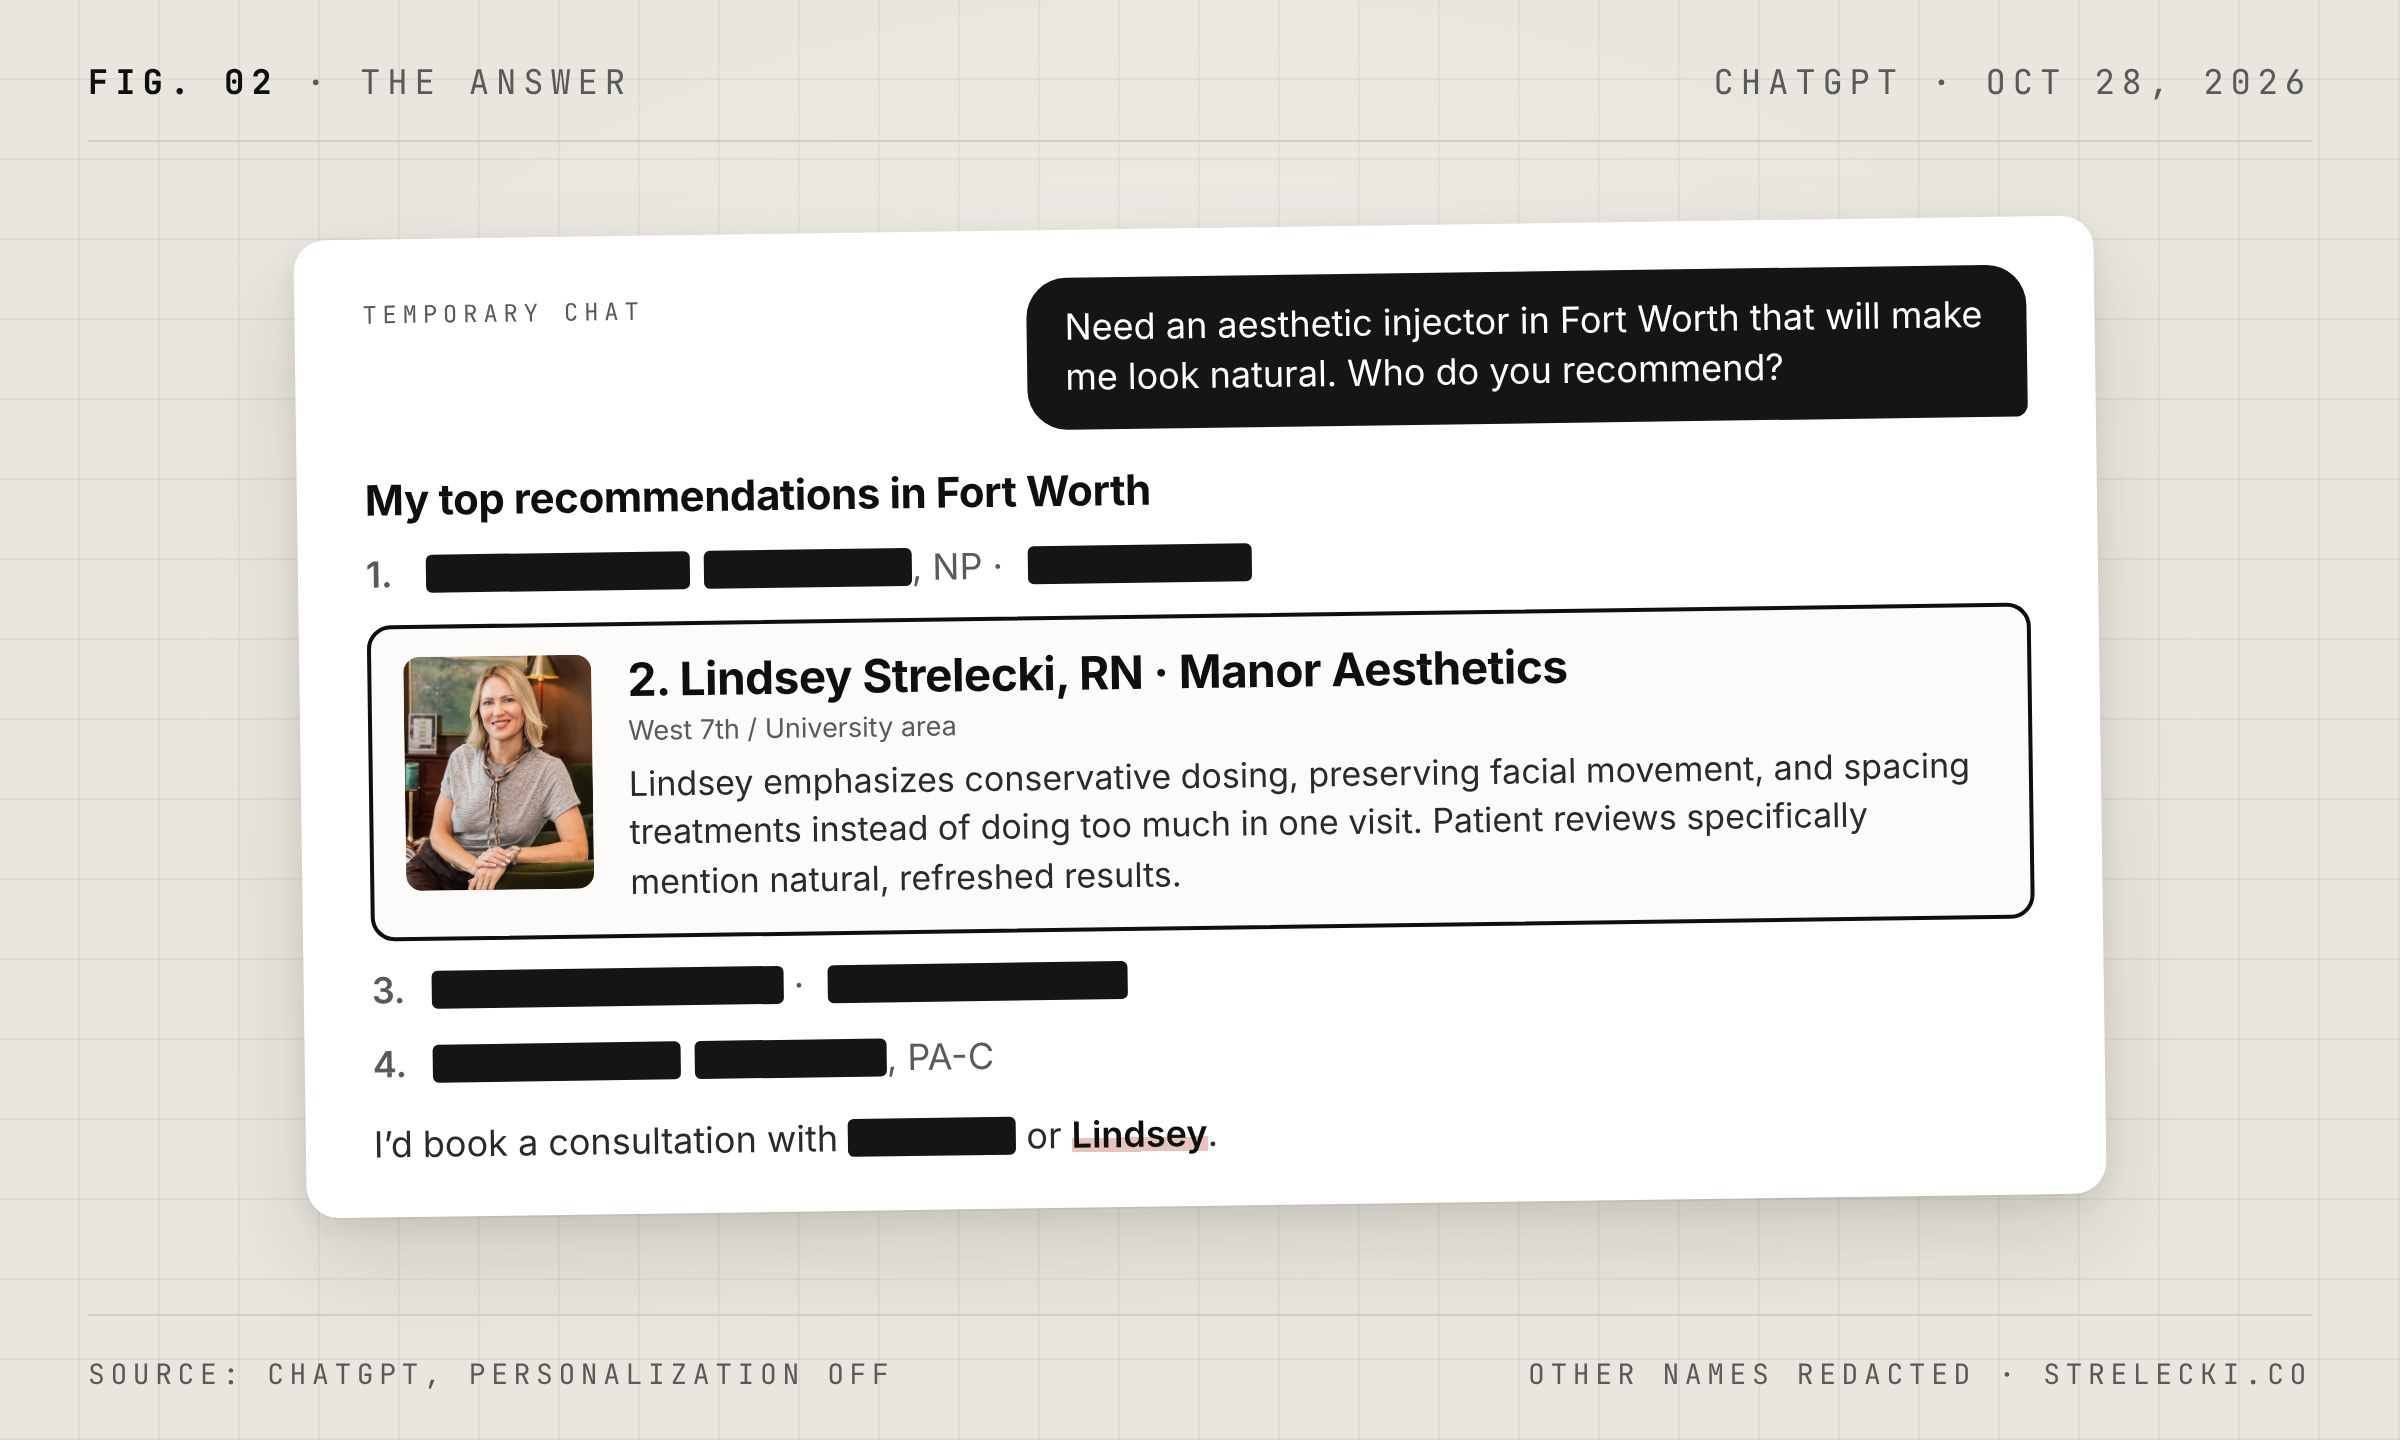
At the end of September, Lindsey was introducing herself to a new patient. The patient said, “Yeah, that’s why I came to you. I asked ChatGPT and...”
Her question was about the best natural-looking injector in Fort Worth, and Lindsey came up first.
That’s when we realized it was working.
I checked the logs. ChatGPT had been pulling up Lindsey’s site almost every day that month to answer somebody’s question. The count is past 100 now.
Google looked like the opposite. Last week I opened Search Console and saw an average position of 44.7. That’s page five, and nobody goes to page five.
My first reaction was the one a good rep has during a manual health check: something broke, go find it. Nothing was broken.
What the average was hiding
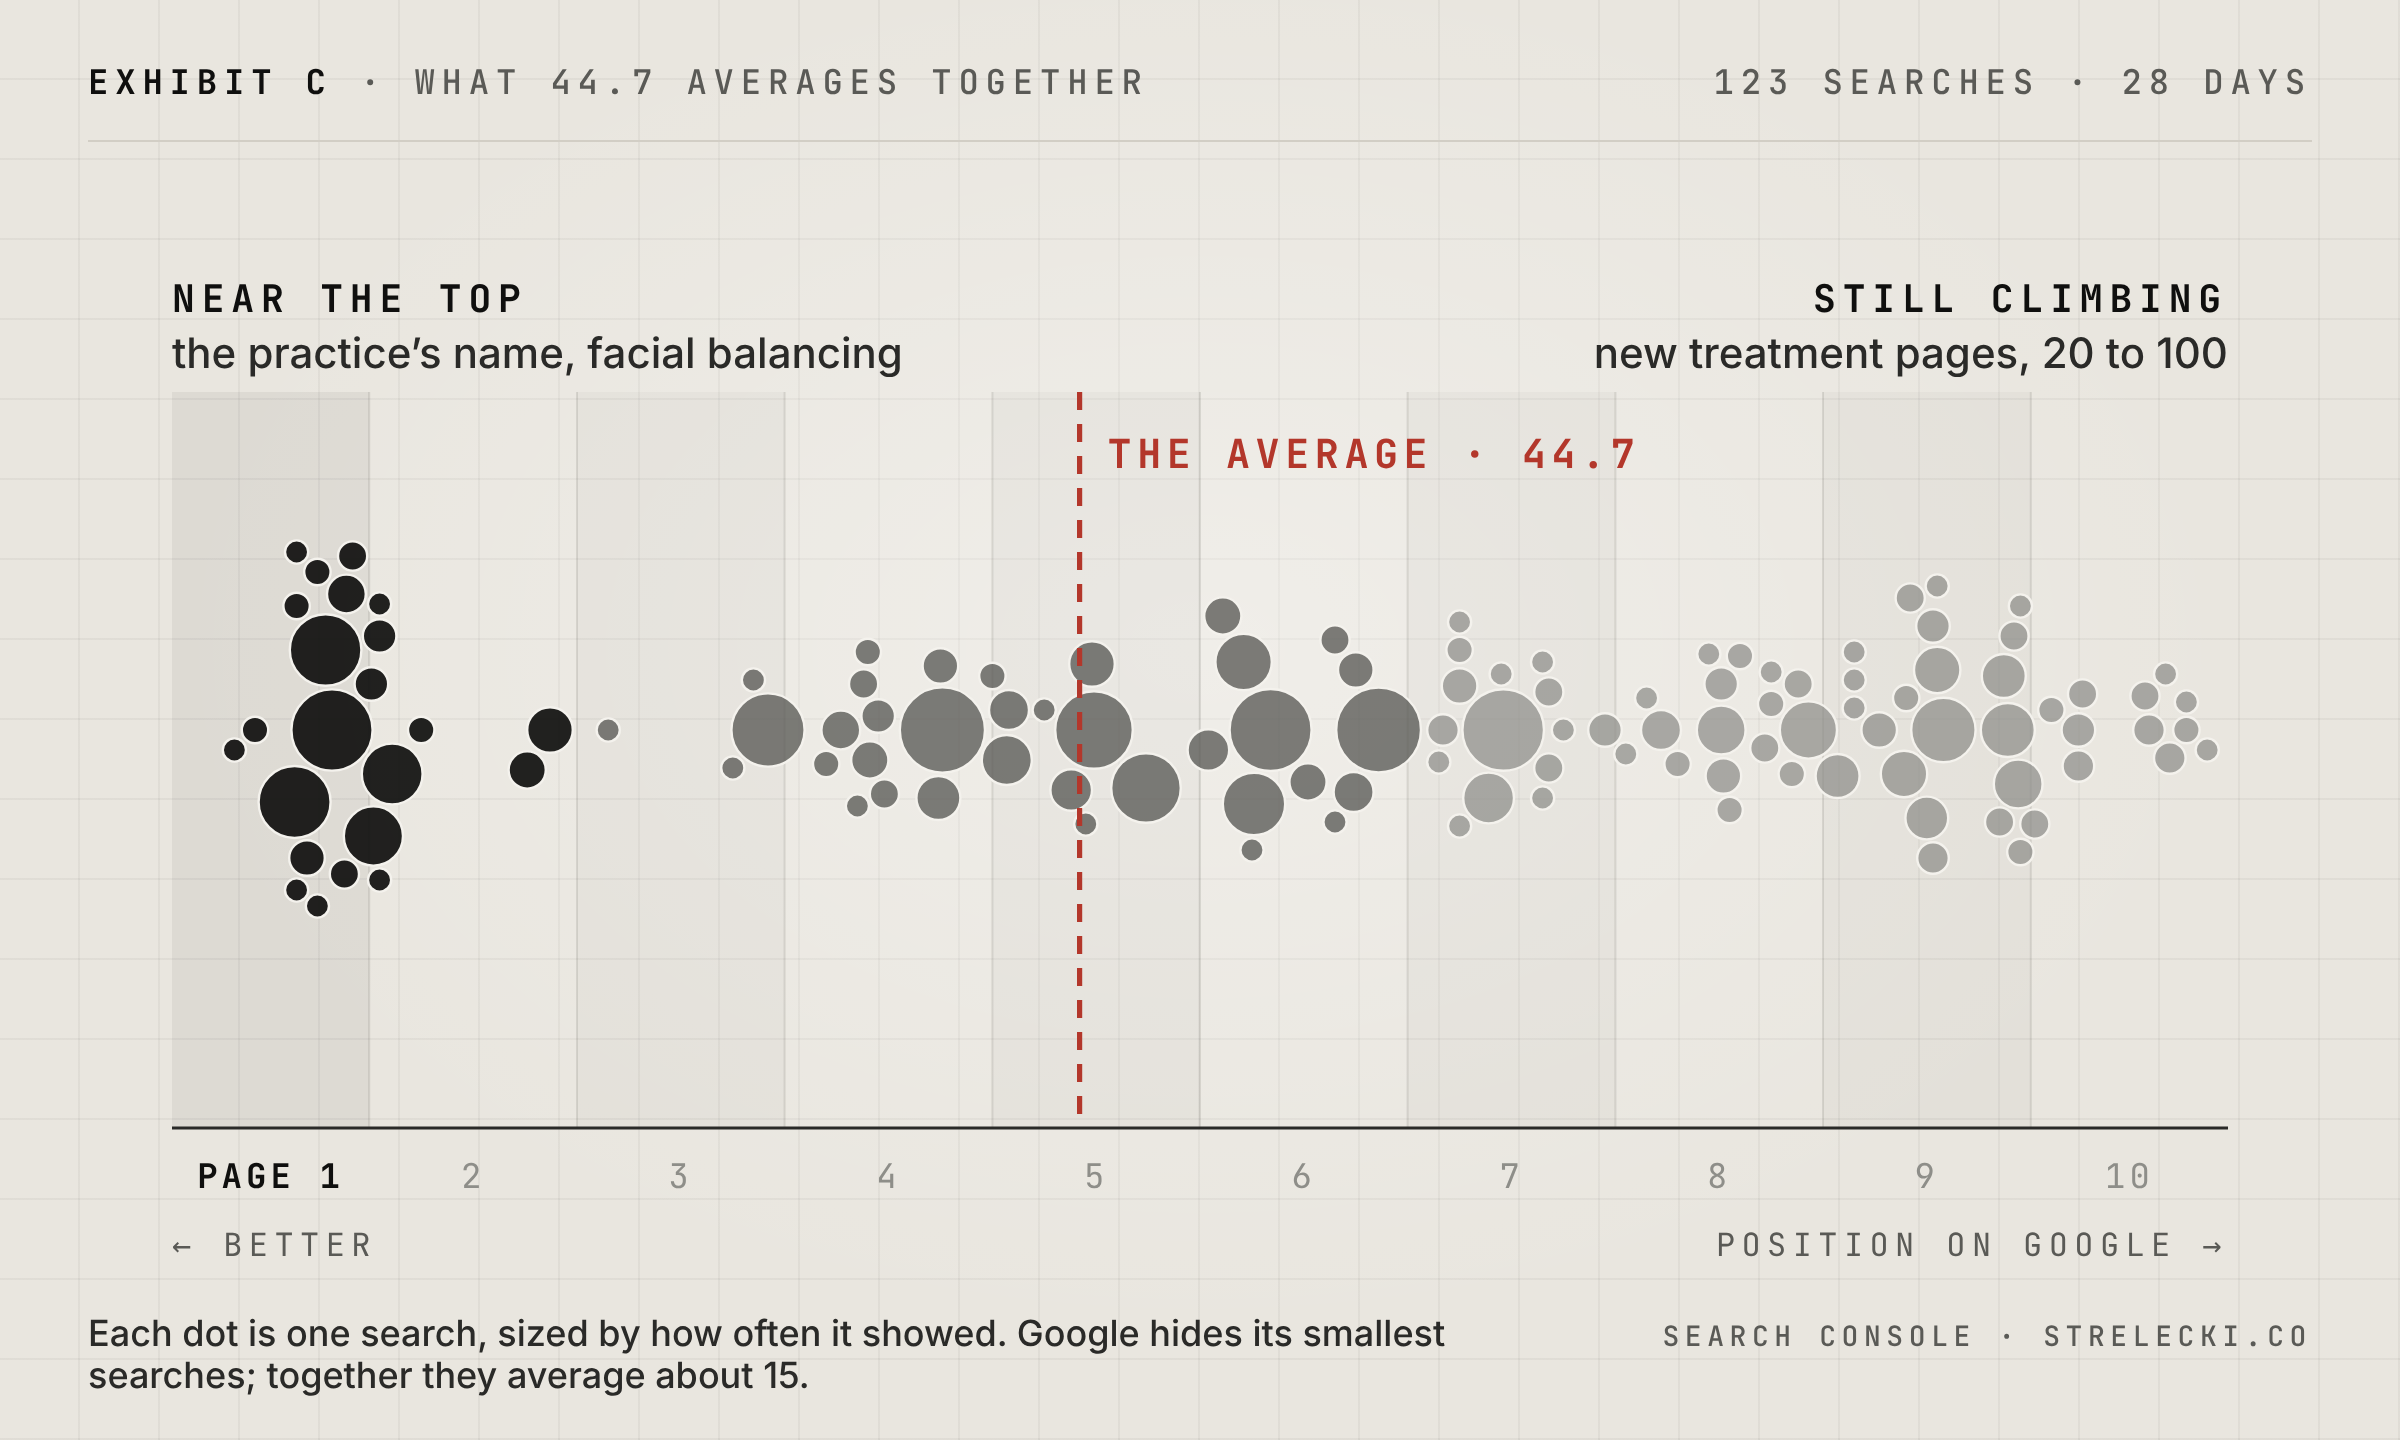
That 44.7 averaged 123 different searches, plus some Google doesn’t list.
Search Lindsey’s name and the site comes up first. Searches for the practice show up around position 8. “Facial balancing near me” was 8.7, which is page one.
The treatment pages are what pull it down. Most of them went live in the last few months, and new pages usually start out deep, often past position 50, then work their way up.
Until they climb, they make the average worse. One week in October, the busiest day had the worst average and the slowest day had the best.
There’s a line on Lindsey’s About page about faces: “the thing a person points to in the mirror is frequently not the thing actually causing it.” Same with this number.
Even good news barely moves it. If our three closest treatments all made page one, the average would only go from 44.7 to about 41.
Why customer success metrics look worse when you grow
If you run a post-sale org, you have a 44.7 too.
If your health score leans on usage, a big onboarding cohort drags the average down, because new customers haven’t ramped up yet. Add seats at an existing customer and license utilization drops until the new people log in.
In both cases you grew, and the dashboard says you got worse.
An average can’t tell the difference between getting worse and getting bigger. When that cohort ramps up next quarter, the average can climb while your established customers slide.
Split it. Pick a cutoff, like go-live or 90 days, and report established customers and seats separately from new ones. The first number shows whether you’re slipping. The second shows how fast the new ones are ramping.
What we track instead
For Lindsey’s site we dropped the average and built a scoreboard: ten searches tied to what pays the bills, mostly injectables and lasers, plus Google clicks and Book taps.
A Book tap means someone is ready to talk to Lindsey. Nobody books a consult because of an average position.
Every Book and Call button on the site sends an anonymous tap to a small counter we run ourselves. It doesn’t use cookies or ad pixels. Booking finishes in Manor’s scheduling system, so the tap is the last step we can see.
ChatGPT still surprised us. Four of the first five people it sent us tapped Book or Call, better than any other source. We wouldn’t know that if we were only counting visits.
Three rules I’d steal for your CS dashboard
Count the hand-raise. For us that’s a Book tap. For you it might be an expansion request or a second admin added. An email open doesn’t count.
Take yourself out of the data. Early on, the busiest visitor on Lindsey’s site was me. One evening, nearly 90% of the page loads were my own automated checks. My computers are marked now so they don’t count. Your internal users and test accounts are probably sitting in your adoption numbers right now.
Don’t forecast off a good week. Visits about tripled in late October, after a site update and a LinkedIn post. I’m still not projecting that forward. Same with a big expansion month: forecast off the last two quarters and let the big month be upside.
One thing to check this week
Pull up your CS dashboard and look at average health score and license utilization. If either got worse in a quarter you grew, split it before anyone asks what went wrong.
Count the taps.
Matt
P.S. If you’re in Fort Worth and want to look like yourself, just rested, the Book button works. I’m counting.
Reading is free. The engine is an email away.
If this post hits close to home, the fix is rarely one more dashboard — it's the operating system underneath. No pitch: email me the one number you can't explain and I'll tell you straight whether I can help.